
Author

Russell Garcia

Browsing

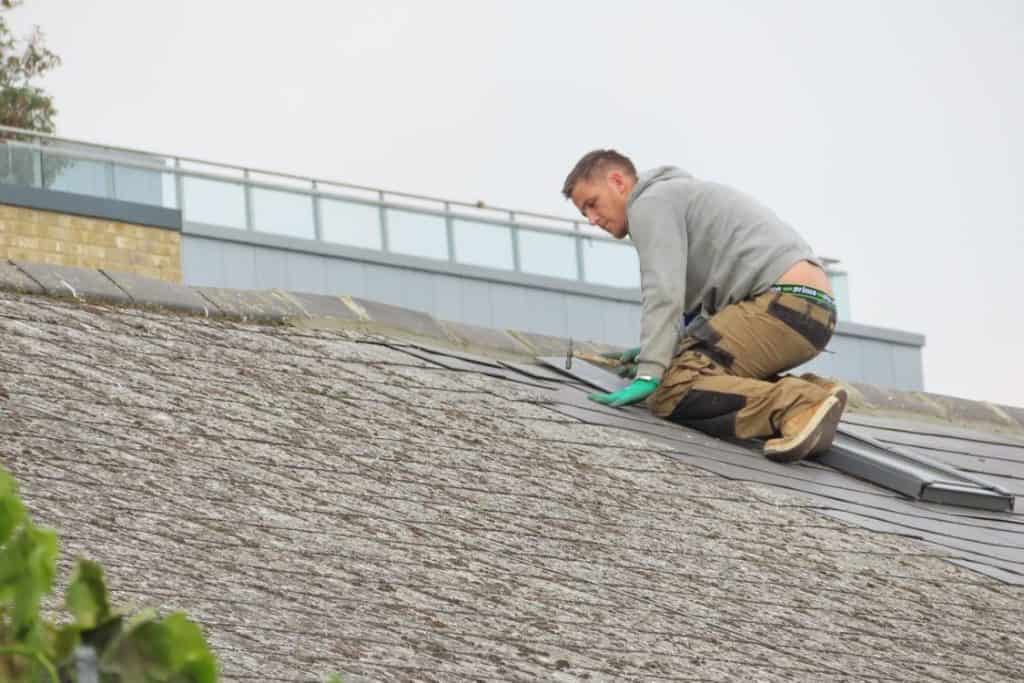
Behind every roofing quote in Peel Region sits a labour-market problem that is only getting tighter. The shortage of skilled trades is not an abstraction or a future worry; it shows up directly, today, in how long a Mississauga homeowner waits for quality work and what that work costs.

Seeing the shortage clearly helps a homeowner respond to it sensibly, by planning ahead and choosing well, rather than being repeatedly frustrated by waits and prices that are not going to ease on their own.

The scale of the gap

The shortage is province-wide and growing. Industry forecasts indicate Ontario will need to recruit over 100,000 workers in construction alone by 2030, just to replace retirements and keep pace with demand.

Roofing competes for that shrinking pool against every other trade, and it does so while a large share of its own experienced hands ages toward retirement. The math is unforgiving: more demand, fewer skilled workers, and a physically tough trade that not enough newcomers are choosing.

How a shortage reaches your roof

The effect on a homeowner is twofold. The first is scheduling: good crews are booked further out, so getting a quality roofer becomes a matter of planning rather than calling around for whoever is free this week. Availability itself becomes a real constraint, especially in peak season.

The second, and more consequential, is quality variance. As experienced roofers retire and the labour pool thins, the spread between a seasoned, well-staffed crew and a hastily assembled one widens. On a roof, that spread is permanent, because the difference between a team that understands ventilation, flashing, and decking and one that does not is the difference between a roof that lasts and one that quietly fails.

What it means for hiring

A homeowner cannot fix the labour market, but they can respond to it intelligently. The premium on an established roofer with a stable, experienced crew rises as skilled workers grow scarce, because those firms can still field a team that genuinely knows the work.

That is why, in a tightening market, it pays to identify the credible firms early rather than scramble during an emergency. Choosing from the strongest options ahead of time beats settling for whoever can start tomorrow, which in a labour-short market is rarely the crew you actually want.

Planning is the homeowner’s advantage

The one lever a homeowner fully controls is timing. Booking an inspection and quote before the busy season gets you onto a good crew’s calendar before the backlog builds, and it removes the pressure that leads people to hire poorly in a hurry.

The roofer shortfall is real and is not resolving quickly, but it does not have to derail a Mississauga homeowner’s project. Plan ahead, choose for proven experience over raw availability, and the labour crunch becomes a scheduling reality to manage rather than a quality risk to suffer. Foresight is the whole strategy.

Something quietly shifted in the Del Mar housing market over the past year, and it is changing how owners spend on their properties. The detached-home picture early in 2026 showed inventory in the 92014 zip code had fallen more than 40 percent year over year, leaving the community with under three months of supply.

When there is almost nothing to buy, the math of moving changes. An owner who might have traded up for a better view or a bigger lot looks around, sees no compelling options, and decides to stay. And owners who stay tend to reinvest in the home they already have, often starting in the backyard.

The Trade-Up Stall and What It Triggers

Low inventory is not a new feature of Del Mar. The village is small, land is effectively fixed, and longtime owners hold their homes for years. But a sharp year-over-year drop tightens the screws further. The handful of listings that do appear are either priced at the top of the market or snapped up fast.

For an established owner, that creates a peculiar form of gridlock. Selling is attractive on paper, but the replacement problem is real. Where do you go that is better, in the same walkable stretch near the beach, without overpaying in a thin market? For many, the honest answer is nowhere obvious.

So the renovation budget that might have funded a move gets redirected. And in a coastal climate where the yard is usable most of the year, the highest-impact place to spend is outside. Outdoor living areas, kitchens, pools, and terraces all get a second look when relocating stops making sense.

This is not speculation about taste. It is a predictable response to a stalled trade-up ladder. When horizontal movement freezes, investment turns vertical, into the property itself.

Why Outdoor Space Absorbs the Spending First

There is a reason the backyard, rather than the kitchen or primary suite, tends to capture this redirected budget in coastal Southern California. The weather makes outdoor square footage genuinely usable, which means a dollar spent there returns daily, not just at resale.

A covered patio with a fireplace extends the evening into the cooler months. A built-in grill and bar turn weekend hosting into something that happens at home instead of out. A reworked pool deck in cool-underfoot stone changes how the whole rear of the property functions. These are lifestyle upgrades that also happen to read well to a future buyer.

The resale logic reinforces the lifestyle logic. In a market defined by scarcity, the features buyers cannot easily find elsewhere carry a premium, and a fully realized outdoor living space is exactly that kind of feature. It is hard to replicate on a different lot and expensive to add late, so a finished one commands attention.

Owners also tend to phase this work, which suits a stay-put strategy. A terrace this year, an outdoor kitchen the next, lighting and planting after that. The property improves in stages without the disruption and cost of a full move.

Phasing has a second advantage in a thin market: it keeps options open. An owner who improves gradually can stop, sell, or keep going depending on where prices head, rather than committing everything to a single all-at-once renovation. In a community where listings are scarce and timing is uncertain, that flexibility is worth something on its own.

There is also a neighborhood effect at work. When a few owners on a street invest in their outdoor spaces, the bar quietly rises for everyone else, and the homes that look dated outside start to feel that way by comparison. Scarcity keeps people in place, and proximity keeps them improving, each yard nudging the next.

The climate makes the calculation easier to justify. In much of the country an elaborate outdoor renovation buys a few warm months of use a year, but coastal San Diego’s mild stretch runs long enough that a well-built patio, kitchen, or pool deck gets used across most of the calendar. The return, measured in days actually spent outside, is simply higher here than almost anywhere else, which is part of why owners are comfortable spending on it instead of moving.

Reading the Market Signal Correctly

It would be easy to misread the inventory drop as simple weakness. The fuller picture is more nuanced: fewer homes for sale, longer days on market for the listings that exist, and sellers receiving close to their asking prices when properties are well prepared. That is a market that rewards patience and presentation, not panic.

For owners, the strategic read is that improving the home you intend to keep is rarely wasted effort here. If you eventually sell into a supply-starved market, a property that shows beautifully outdoors stands out. If you keep it, you have spent on space you actually use.

None of this means values only go up or that every dollar in the yard returns at resale. Markets correct, and over-improving beyond a neighborhood’s ceiling is a real risk anywhere. An owner weighing a major outdoor project should treat it first as a lifestyle decision and second as an investment, and price it against comparable finished properties nearby.

But the underlying behavior is clear enough. When the market gives owners few good reasons to leave, they pour their attention into the ground they already own. In Del Mar, that ground is increasingly the backyard.

A competitive gaming mouse used to be a substantial object. The popular models of a decade ago weighed close to a hundred grams, carried a braided cable, and felt planted on the desk. The surface underneath them barely mattered, because the mouse supplied most of the feel on its own.

That era is over. The mouse on a serious player’s desk today is a fraction of the weight it once was, wireless, and so light it almost disappears in the hand. And in shedding all that mass, it quietly handed a much bigger job to the thing it slides across.

Most people upgrading to a modern mouse never connect these two facts. They feel that aiming has changed and assume it is the mouse. A good part of it is the surface, suddenly doing work the heavy mouse used to do for them.

The Weight Dropped by Half

The shift toward lighter mice has been one of the defining hardware trends in competitive gaming, and it has gone further than most casual players realize. The category-defining mice now sit far below the old hundred-gram norm.

Reporting on the trend notes that the latest designs cut weight to well under 65 grams, with some competitive models pushing toward forty. That is roughly half the mass players were swinging around a decade ago.

Going wireless amplified the change. Cutting the cable removed not just weight but the inconsistent drag that a cord introduces as it catches and releases across the desk, which had always added a hidden, variable resistance to every motion.

The result is a mouse with very little inertia of its own. It starts moving the instant the hand pushes and it wants to keep moving when the hand stops, because there is so little mass to settle it. That responsiveness is the whole appeal, and also the catch.

A Lighter Mouse Puts More on the Surface

A heavy mouse is partly self-stabilizing. Its mass smooths out small tremors and helps it coast to a stop in a predictable way, which means the surface it sits on can be mediocre without the player noticing much.

Strip that mass away and the surface inherits the job. With almost no inertia damping the motion, the friction of the pad and the glide of the mouse feet become the dominant influence on how the mouse starts, travels, and stops. The pad is now doing the steadying the mouse used to do.

This is why two players with identical ultralight mice can have completely different experiences depending on what is under them. A fast, slick surface lets the light mouse fly but can feel skittish and hard to halt precisely. A higher-friction surface adds the stopping power the mouse no longer provides on its own.

The practical upshot is that choosing the right mouse pad matters more in the ultralight era, not less. The lighter the mouse, the more of the feel is coming from the surface, and the more a poor one will sabotage an expensive piece of hardware.

What to Actually Look For Now

The first thing to reconsider is the assumption that the mouse alone determines how a setup feels. With a modern lightweight mouse, the surface is at least an equal partner, and treating it as an afterthought wastes the precision the mouse is capable of.

Consistency matters more than any single characteristic. A surface that glides the same way across its whole area and behaves identically session after session lets the player build stable muscle memory, which is the entire point of investing in precise gear.

From there it becomes a question of matching the surface to the feel a player wants. Those who want raw speed lean slick, while those who want control and easy stopping lean toward more texture, and the lightness of modern mice makes that choice far more noticeable than it used to be.

The mouse industry will keep chasing fractions of a gram, and the headlines will keep going to the hardware. But the quiet truth of the ultralight era is that the lighter the mouse gets, the more the surface beneath it decides how that mouse actually performs. The pad stopped being a passive mat the day the mouse stopped carrying its own weight.

The story everyone expected to drive American industrial steel demand was a factory reshoring boom. The story that actually showed up was data centers.

That shift matters for the unglamorous end of the steel market, the general-purpose structural plate that goes into base plates, equipment supports, skids, platforms, and the low-pressure tanks and enclosures that fill out an industrial site. When construction activity rotates from one sector to another, the demand for that everyday plate follows it.

The construction boom moved, it did not disappear

Factory construction has cooled from its peak. The semiconductor-driven surge that dominated 2023 and 2024 has faded as fab spending came off its highs, and overall manufacturing construction has slipped from its record.

Data centers picked up the slack and then some. U.S. data center construction has grown to roughly $47 billion annualized as of early 2026, according to IoT Analytics, up from under $10 billion just six years earlier. That is close to a fivefold increase, with year-over-year growth holding above 30 percent for four straight years.

Behind that number is an obvious driver. Hyperscale operators poured record sums into AI infrastructure, and each new campus is a sprawling civil and structural project before any servers arrive.

Power infrastructure is shaping up to be the next leg. Grid constraints are forcing a wave of utility spending, which adds substations, switchyards, and generation equipment to the list of things that need fabricated steel.

Where everyday structural plate fits into all of this

A data center or a substation is not built from exotic alloys. It is built mostly from ordinary, dependable carbon steel, sized and detailed for strength rather than for pressure or extreme temperature.

That is the role general-purpose plate plays. It anchors columns, carries equipment, stiffens enclosures, and forms the bottoms and walls of low-pressure tanks. It does not need to be remarkable. It needs to be consistent, weldable, and available in volume.

A specification like ASTM A283 exists precisely for this kind of low-to-intermediate strength structural duty, covering carbon steel plate of moderate yield used where toughness and pressure ratings are not the governing concern. It is the kind of grade a fabricator orders by the truckload rather than by the certified heat.

That ubiquity is exactly why a construction rotation shows up in plate demand so directly. When billions of dollars of work moves from one kind of site to another, the workhorse grades move with it.

The fabricators serving data center and power projects are not chasing premium metallurgy. They are chasing reliable supply of plain structural plate at a predictable price, delivered on a schedule that keeps a fast-moving construction site fed.

What the rotation means for steel buyers

For anyone supplying or buying structural plate, the lesson is to watch where the construction dollars are landing rather than fixating on headline narratives about manufacturing.

The reshoring boom that filled press releases has been more modest in the data than the announcements suggested. The data center and power buildout, by contrast, is showing up clearly in the construction spending figures.

That has practical implications. Demand for general-purpose plate is concentrating around the regions and contractors winning data center and grid work, which changes where material needs to be staged and how far ahead orders should be placed.

It also rewards suppliers who can move volume. The premium in this segment is not metallurgical sophistication. It is availability, consistency, and the ability to deliver standard plate fast enough to keep a 30-percent-growth construction sector on schedule.

The AI buildout will keep reshaping where steel gets consumed for years. The plate underneath it all is about as ordinary as steel gets, and that ordinariness is the reason demand for it follows the cranes wherever they go next.

Some of the most important programs for older adults are also the least famous. The Program of All-Inclusive Care for the Elderly is a good example: decades old, quietly effective, and largely unknown to the families who would benefit most.

That obscurity is starting to crack. Early in 2026, the model passed a milestone with the opening of its 200th PACE program, part of a network now serving more than 90,000 older adults across the country.

For San Diego families, the growth is worth understanding, because a model reaching that scale is no longer experimental.

From Demonstration Project to National Network

The concept began as a single community effort and spent years as a small demonstration. The idea was simple and stubborn: keep frail older adults in their communities rather than institutions, by coordinating all their care through one team.

For a long time, growth was slow. The model is complex to launch, and many families and even providers did not understand it.

What changed is the math of aging. As the older population swelled and the cost of institutional care climbed, a program that keeps people home while controlling costs became far more attractive to states and families alike.

Why Scale Changes the Conversation

Reaching hundreds of programs and tens of thousands of participants does more than pad a statistic. It builds a track record.

At small scale, a care model is a promising idea. At national scale, it is a proven system with outcomes that can be measured: fewer hospitalizations, more people staying in their homes, families with a coordinated team instead of a phone tree.

That track record is what should put the model on the radar of San Diego families who have never heard of it. The question is no longer whether it works, but whether it fits a particular person’s situation.

And fit is specific. The model targets adults who need a high level of care but can still live safely at home with support. For the right person, the difference between scattered care and coordinated care is the difference between crisis and stability.

Catching Up to a Model That Already Arrived

The lesson for families is to stop treating coordinated community care as a novelty. It is a mature option that simply suffers from a marketing problem.

If you are caring for an older parent in San Diego, the worth-knowing fact is that this approach exists, that it has served tens of thousands of people, and that the main barrier for most families is awareness rather than availability.

A model can be three decades old and still feel like news to the family that just discovered it. For many San Diego households, that discovery is the most useful thing they will learn this year.

For decades, the grease-resistant coatings that stop a meat pie or a burger from soaking through its wrapper relied on a class of chemicals that has since become one of the most controversial in the world. That era is now ending, and it is reshaping how food businesses choose their packaging.

The shift matters for any business that puts food in contact with paper.

What Changed in 2025

PFAS, the so-called forever chemicals prized for resisting heat, grease and water, have come under intense regulatory pressure globally. In Australia, the government banned the manufacture, import, export and use of three legacy PFAS chemicals from 1 July 2025.

The relevance to food packaging is direct. Grease-resistant wrappers and coatings were a common application for these chemicals, exactly the function that keeps oily food from leaking through paper.

The concern is that PFAS do not break down, persisting in the environment and accumulating in the body, with mounting links to health and environmental harm. Regulators here and overseas are steadily tightening the rules, and a Senate inquiry has kept the issue firmly on the agenda.

For food businesses, this is not a distant policy debate. It is a question about what is touching the food they sell, and whether their packaging meets a standard that is only getting stricter.

The Move to Safer Materials

The good news is that effective PFAS-free alternatives exist and are now mainstream. Properly engineered greaseproof papers achieve oil and moisture resistance through the structure of the paper itself rather than problematic chemical coatings.

This is part of why sourcing from a knowledgeable supplier matters more than it used to. A provider like Star Stuff Group that understands food-contact requirements can supply paper that performs without relying on chemistry that is being phased out.

The functional trade-off that once justified PFAS is largely gone. Modern greaseproof papers handle the grease while sidestepping the regulatory and reputational risk that legacy coatings now carry.

Getting Ahead of the Curve

For food businesses, the practical move is to ask suppliers directly about what is in their packaging and whether it is PFAS-free, rather than assuming. Documentation and supplier transparency are becoming part of doing business responsibly.

Designing for the strictest market, rather than the most permissive, is the prudent long-term strategy. Regulations are tightening, not loosening, and packaging chosen today will still be in use as the rules continue to evolve.

There is also a consumer dimension. Diners increasingly care about what their food touches, and being able to say packaging is free of forever chemicals is becoming a genuine point of trust.

The PFAS phase-out is a reminder that packaging is never just packaging when food is involved. The wrapper is part of the product, and the materials that go into it are now under a level of scrutiny that rewards businesses for getting ahead of the change.

Tracking silver price movements can sharpen the timing of purchases and help buyers capture better value. Markets react to a steady stream of news, data and trader behavior so a clear plan matters.

A blend of chart work, raw data and a feel for the market gives a more complete picture than any single signal. Patience and a rule based approach reduce knee jerk reactions when prices swing.

Know What Moves Silver Prices

Macro factors such as interest rates and inflation pressure often push metal prices up or down and can trigger big swings. Industrial demand and new uses for silver shift consumption patterns while mine output and recycling change available supply.

Investor flows into coins, bars and exchange traded funds create volatility when sentiment flips quickly. Political risk and safe haven buying add extra fuel to moves when fear enters the market.

Use Technical Analysis Tools

Charts help reveal whether a price move is likely to continue or stall by showing trend, momentum and key levels that traders respect. Moving averages smooth noise and crossings offer simple signals while oscillators like the relative strength index show exhaustion or fresh energy in a trend.

Support and resistance levels work as reference points to place buys when the risk reward looks attractive. Pattern recognition across multiple time frames gives more confidence than a single timeframe read.

Follow Economic Indicators

Inflation reports and central bank rate decisions tend to sway precious metals because they change real yield expectations and the appeal of holding cash. Employment and manufacturing data alter growth forecasts which in turn affect industrial metal demand and safe haven flows.

Trade reports that shift currency balances or tariffs can also change physical demand for a country and push prices. Tracking a short list of high impact releases lets you plan around potential spikes in volatility.

Watch Currency Movements

Silver often shows an inverse relation with the US dollar so tracking the dollar index gives context to price swings in dollar denominated markets. When the greenback softens buyers using other currencies find silver cheaper and demand can rise, which tends to lift spot prices.

Currency moves also reflect global confidence and capital flows that reach into commodities as an outlet. Keeping a small watchlist of major currency pairs helps gauge cross market pressure.

Monitor Supply And Demand Signals

Mine production forecasts, smelter disruptions and recycling data all feed into the supply side and create real constraints that markets price in. On the demand side industrial uptake, jewelry orders and coin sales record concrete need for the metal and can surprise the market if they shift.

Shipping times, seasonal demand spikes and local premiums reveal tightness before headline statistics catch up. Observing both production reports and consumption facts yields a clearer picture of potential shortages or surpluses.

Track ETF And Futures Activity

Exchange traded fund holdings show how much metal investors are storing on balance sheets and sudden inflows or outflows can push prices strongly. Futures markets reveal trader positioning through reports that break down long and short stances and highlight how leveraged players are set up.

Open interest and volume changes around moves give clues about whether a rally has conviction or is thinly traded. Large shifts in these numbers often precede abrupt price reversals when traders rush for the exits.

Set Alerts And Use Automated Tools

Price alerts free you from constant staring at screens while still getting notified when a key level is hit and a trade setup appears. Trend cross alerts and relative strength triggers can be tied to simple rules so the same action follows each signal and emotional bias drops out of the equation.

Traders should remember that global silver supply impacts availability at Money Metals, meaning some setups may need faster execution if inventories tighten.

Several charting platforms allow scripting for custom conditions which helps execute a plan with consistent timing. Automating routine checks leaves head space for bigger judgments when the market throws a curve ball.

Study Historical Patterns And Seasonality

Silver has shown recurring seasonal behaviors that traders can map by comparing similar months and macro contexts over many years. Past corrections and rallies teach what sort of pullback is normal and what looks like a major structural change that warrants a different approach.

Look at cycles across multiple time spans to find recurring low risk entry windows that align with your strategy. Knowing the past does not guarantee the future but it supplies probability edges that tilt the odds in your favor.

Pay Attention To Market Sentiment

Reports on trader positioning, surveys and social chatter help gauge whether a move has broad support or is the product of a small group of traders. Sentiment reads that hit extremes often precede corrective phases where price moves retrace part of the prior advance or decline.

Combining sentiment cues with volume and price action offers a clearer signal than sentiment alone would provide. Sentiment tools can highlight when the crowd is overly bullish or overly bearish and when contrarian buying or selling makes sense.

Manage Risk And Position Sizing

Sizing positions by a fixed percent of capital and setting stop points reduces the chance that a single trade wipes out gains and keeps decisions unemotional. Use price risk rather than dollar risk to determine how many ounces or contracts you buy so stops remain logical when market volatility rises.

A tiered entry plan that averages into a position on confirmed signals lowers regret when timing is imperfect. Risk control turns a string of small losses into a sustainable approach rather than leaving everything on the line.

Combine Multiple Signals Before Acting

Relying on a single indicator invites whipsaws so require at least two independent signals to align before placing a larger order. A typical confirmation might include a technical breakout supported by fresh ETF inflows and a central bank statement that loosens policy.

Mixing timeframes and data types reduces the chance that noise drives a trade while keeping the system nimble enough to catch genuine trends. The aim is to stack modest edges so that overall odds favor the buyer when action is taken.

Keep A Trading Journal

Document entries, exits and the reasoning behind each move so the record reveals patterns of success and recurring mistakes over time. Note market context, the signals that were in play and how emotions influenced execution on key trades to spot behavioral leaks that cost money.

Periodic review of the log helps refine rules, prune ineffective signals and build a clearer sense of what timing methods work for your temperament. A disciplined record acts like a coach that points out both strengths and blind spots in plain terms.

In April 2026, a long-lasting weather pattern blasted hot air across the eastern United States like a furnace. Temperatures soared into the 90s from Georgia to New York. In Washington D.C., forecasters called for highs of 93 degrees. In Philadelphia, 92. AccuWeather senior meteorologist John Feerick described it as “borderline unprecedented as far as the duration of it this time of year.”

For Florida, which never really cools down, the early heat was not a surprise – but the intensity was. How hydration becomes a daily guessing game in Florida is not just a quirk of subtropical living. It is a warning sign that the body’s signals are no longer reliable in an environment that is changing faster than human physiology can adapt.

The Numbers Behind the Crisis

Heat is the number one weather-related killer in the United States, according to the National Weather Service. And Florida leads the nation in heat-related emergency room visits. According to the Centers for Disease Control and Prevention, 119,605 heat-related illness emergency department visits were recorded nationwide in 2023, with 92% occurring during May through September. Florida’s share of that burden is disproportionate.

In 2022, the most recent year for complete state-level data, more than 5,800 Floridians went to hospital emergency rooms for heat-related illness. That was the highest total of any state. Florida recorded 25.2 heat and heat-related illness emergency department visits per 100,000 people – the sixth-highest rate in the country.

The Florida Department of Health defines extreme heat as conditions when high temperatures, coupled with high humidity, overwhelm the body’s natural cooling mechanisms. In Central Florida, humidity often runs above 70%, which disables the primary cooling system – sweat evaporation. A 90-degree day that feels manageable in Phoenix becomes genuinely dangerous in Orlando because the moisture in the air prevents the body from shedding heat.

Dr. Richard Petrik, director of emergency medicine for HCA Florida Ocala Hospital, advises avoiding the sun during peak hours between 10 a.m. and 4 p.m., taking breaks in shade, and checking on vulnerable populations. But for many Floridians, especially outdoor workers, seniors, and tourists, those warnings are easier to give than to follow.

Why Hydration Is a Guessing Game

The human body is approximately 60% water. Adults should aim for about 3.7 liters daily for men and 2.7 liters for women, according to general guidelines. In hot climates, those needs increase significantly. But knowing those numbers and meeting them are different challenges.

For seniors, the problem is biological. The thirst sensation weakens with age. By the time an older adult says “I’m thirsty,” they are often already mildly dehydrated. Many seniors take medications – diuretics for blood pressure, beta blockers for heart conditions, anticholinergics found in sleep aids and antidepressants – that interfere with heat regulation. Roughly half of seniors in Central Florida take at least one prescription that raises heat illness risk. Add Florida’s humidity, and the body’s cooling systems fail quietly.

For outdoor workers, the problem is structural. Construction crews, landscapers, agricultural workers, and delivery drivers face hours of direct sun exposure with limited access to shade or clean water. The early-season heat is particularly dangerous because bodies have not acclimated. “The early-season heat can be more stressful on people’s bodies since they haven’t had a chance to acclimate,” meteorologists warn.

For tourists, the problem is unfamiliarity. Visitors to theme parks and beaches often underestimate the combined effect of heat and humidity. During a July 2025 heat wave, Disney World first responders rushed to 86 heat illness calls over 11 days. Around one in four ended in hospital visits. The youngest patient was a baby under one year old. The oldest was an 81-year-old woman. The most dangerous day saw a heat index of 113 degrees – only the fifth time Orange County had ever recorded that level.

The Warning Signs Most People Miss

Heat exhaustion develops gradually. Excessive sweating, fatigue, muscle weakness, nausea, shallow breathing, and rapid pulse are early symptoms. Heat stroke is the medical emergency – confusion, altered mental status, slurred speech, loss of consciousness, hot dry skin or profuse sweating, seizures, and body temperatures above 106 degrees. Left untreated, heat stroke causes organ damage and death.

Dr. Ariel Mejia, a faculty member at the University of Central Florida’s medical school, explains the progression: heat exhaustion occurs when people become dehydrated over time and feel tired or sick. Retreating to shade and drinking water helps recovery. Heat stroke is when core temperature rises to the point where muscles break down, mental confusion sets in, and organs suffer damage.

University of Florida professor Thomas Clanton published research in 2025 finding that mice suffer from obesity, chronic heart disease, and other long-term health problems for months after heatstroke – the equivalent of years for humans. Most human patients are not tracked long-term after ER visits, so the full consequences of heat illness remain poorly understood.

What Actually Works

The advice is consistent across medical sources, even if following it is not always simple. Drink water regularly, not just when thirsty. Avoid alcohol and caffeinated drinks, which dehydrate. Take repeated breaks from sun exposure. Keep indoor temperatures at or below 78 degrees for older adults. Wear light, loose clothing and hats. Monitor urine color – dark yellow signals dehydration.

For seniors, hydration needs to run on a schedule, not on thirst. A reasonable target is 6 to 8 cups of fluid daily, more on days with outdoor activity. Water-rich foods – watermelon, cucumbers, celery, soups, broths – can increase fluid intake by 20 to 30% without turning hydration into a battle. Caregivers who know a senior’s preferences can adjust meals quietly to boost fluid consumption.

For outdoor workers, employers have a legal and moral obligation to provide access to water, shade, and rest breaks. The Occupational Safety and Health Administration recommends employers establish heat illness prevention programs that include hydration schedules, buddy systems to monitor workers, and emergency response plans. In Florida’s climate, these are not optional perks. They are survival infrastructure.

The Bigger Picture

Florida’s heat problem is not going away. Orange County was under heat advisory 13 times in one recent year, compared to just two times in 2019. July 2025 was the 14th-hottest July on record in 130 years. The coolest temperature on July 28 was 78 degrees – a record warm daily low that meant no overnight relief.

Climate projections suggest Florida will see more frequent and intense heat waves, longer warm seasons, and higher overnight temperatures that prevent recovery. The state’s aging population – Florida has one of the highest median ages in the country – makes the vulnerability demographic as well as meteorological.

For individuals, the message is personal. The people who survive Florida’s heat are not the ones who guess right. They are the ones who stop guessing and start treating water like medicine – scheduled, measured, and non-negotiable.

Six of ten LEC partner teams changed their mid laner heading into 2026. Karmine Corp brought in Kang “Kyeahoo” Yea-hoo from the LCK. Fnatic paid a six-figure buyout to land Vladimiros “Vladi” Kourtidis from KC. Team Vitality pivoted to Marek “Humanoid” Brázda after missing out on Vladi. NAVI, SK Gaming, and Natus Vincere all made changes at the position as well.

The result is a LEC where nearly every team is running a different macro identity in the mid lane than they were twelve months ago — which is exactly the kind of structural shift that reshapes what solo queue feedback loops reinforce as the wrong patterns to grind into muscle memory.

The mid lane matters disproportionately in structured League of Legends because it is the position with the most macro influence over the rest of the map. A mid laner who controls wave correctly can extend or deny roaming windows for both jungle sides, apply pressure on objectives through teleport timing, and dictate the pace of the early-to-mid game transition more than any other role.

When six teams simultaneously refresh who is doing that job, the patterns of play that emerge across the split become a live experiment in how different mid lane philosophies affect team-wide decision-making.

For coaches, the practical implication is a more varied library of mid lane archetypes to draw from when explaining positioning and wave management to students. Kyeahoo at Karmine Corp, coming from a LCK system where macro precision is a baseline expectation, plays differently than Vladi at Fnatic, who has built his LEC reputation on aggressive carry-forward mid lane play.

Humanoid at Vitality is a veteran who understands how to manage a team through macro calls in a way that younger players are still developing. Having all three styles visible in the same split, playing against each other week over week, makes the differences legible in a way that individual VOD sessions rarely achieve.

The broader implication for anyone studying mid lane coaching is about how long it takes new team structures to stabilize into recognizable patterns. Most of these rosters need time to convert individual skill into coordinated macro execution.

That stabilization process — the weeks where teams are adjusting to new mid lane voices, new roaming habits, new teleport timing cultures — is one of the most instructive periods for anyone trying to understand what League of Legends macro actually requires beneath the surface of champion mechanics and individual performance.

Imagine scanning a local park in 2022 to earn a handful of Pokéballs, only to find out years later that the visual data you uploaded is now helping a delivery robot navigate a crowded sidewalk in Helsinki. That scenario is no longer hypothetical. In early 2026, it became the center of one of the more unusual data controversies in mobile gaming history.

Niantic, the company that created Pokémon GO, spun out its enterprise spatial intelligence division in 2025 after selling the games business to Scopely. That division, now operating as Niantic Spatial, has been using a decade of AR scan data collected through Pokémon GO to train a Large Geospatial Model — essentially a spatial AI system designed to help machines understand and navigate real-world environments.

One of its first disclosed applications was a partnership with Coco Robotics, helping approximately 1,000 suitcase-sized delivery vehicles traverse city streets using visual data that originated, at least in part, from players scanning PokéStops for in-game rewards.

The story went viral for an obvious reason: most players had no idea. Euronews ran a fact-check in March 2026 that attempted to add nuance. The AR scanning feature, introduced in 2020, was opt-in and required players to actively submit scans rather than passively collecting data in the background. It was also only available to players who had reached level 20. The argument that players “technically consented” through Terms of Service has been Niantic’s consistent position.

Critics have pushed back on what consent actually means in that context. A player scanning a park in 2022 to earn bonuses was agreeing to help “improve the game” — not to fund the navigation infrastructure of an autonomous delivery network.

The gap between what players understood they were doing and what that data was ultimately used for is wide enough that multiple legal commentators have flagged it as a meaningful ethical problem, even if it doesn’t rise to a clear legal violation under current frameworks.

The controversy has had a notable effect on how players think about the accounts they built during the Niantic era — the level 50 profiles, the shiny legendary collections, the stardust reserves accumulated over years of daily play — which now live inside Scopely’s product while the scan data some of those players contributed belongs to an entirely separate enterprise AI business.

None of this affects gameplay directly. Pokémon GO continues running under Scopely, events are still running, legendaries are still appearing in raids, and the competitive scene is active. But the revelation about how scanning data was used has visibly affected how some players think about their ongoing participation — and about the difference between playing a game and contributing to an industrial data project inside a game’s wrapper.

The Niantic pivot is a preview of where AR gaming is heading. Spatial data collected through consumer apps is becoming a serious commercial asset, and the games that collect it most effectively are the ones with large, engaged, geographically distributed player bases. Pokémon GO fits that description better than almost any other app in existence. The question of whether players were adequately informed about that value extraction is one that regulators in multiple jurisdictions are now paying attention to.

Pin It